What is shown?
Acid production and recovery.

The Stephan curve illustrates how plaque pH may fall after fermentable carbohydrates and then recover. Bacteria produce acids, while saliva supports recovery. The curve explains a principle rather than measuring an individual's decay risk.
For training & practice ↓
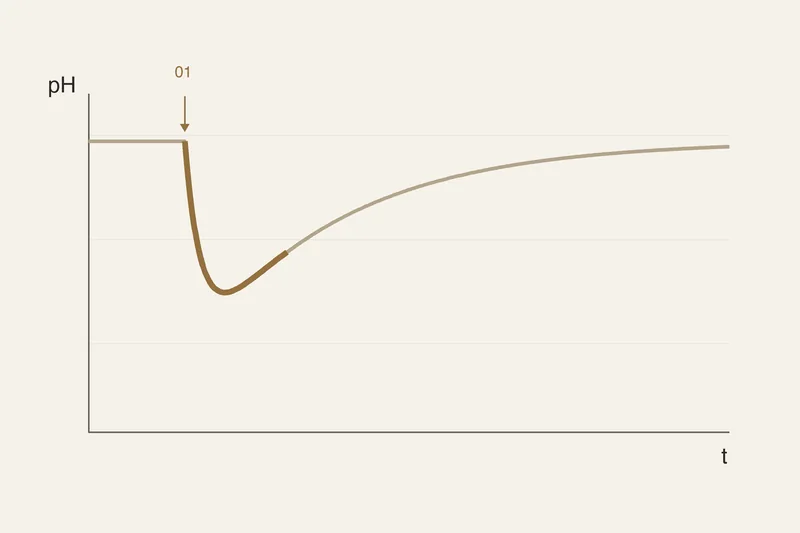
Plaque bacteria can convert sugar into acids. A falling pH indicates a more acidic environment.
Saliva dilutes and buffers acids. The pattern and duration depend on factors including plaque, saliva and the food involved.
Frequent sweet sipping or snacking can trigger further acid episodes. Frequency matters alongside the overall amount consumed.
Plaque bacteria can convert sugar into acids. A falling pH indicates a more acidic environment.
Saliva dilutes and buffers acids. The pattern and duration depend on factors including plaque, saliva and the food involved.
Frequent sweet sipping or snacking can trigger further acid episodes. Frequency matters alongside the overall amount consumed.
Acid production and recovery.
Plaque, saliva and food.
Notice continual sweet sipping.
Three steps. No audio.
Each scene can also be selected manually.

Silent educational film with German on-screen text and simplified teaching images. Not a patient case or a promised treatment outcome. The full English explanation is available as text.
The Stephan curve concerns bacterial acid in plaque. Acidic drinks can also act directly on dental hard tissue, even without sugar.
That cannot be promised universally. A teaching curve shows a typical pattern; individuals and products differ.
No. Composition, quantity and frequency matter. The curve is not a reason to miss necessary meals or ban foods indiscriminately.
Water supplies no sugar for further bacterial acid production. It is therefore a sensible default drink, but does not replace cleaning or necessary treatment.
Editorially suggested question to discuss with Dr Niusha Barahmand Pour:
Which recurring eating and drinking habits are relevant to my decay risk?
Do small drinks or snacks accompany your whole day? Reviewing them can reveal relevant sugar and acid exposures.
Discuss everyday preventionAppointment selection at DoctolibThe Stephan curve concerns bacterial acid in plaque. Acidic drinks can also act directly on dental hard tissue, even without sugar.
Editorial research: . General information, not an individual diagnosis or treatment recommendation. Teaching illustrations are simplified and do not depict a patient case.